Northland Community & Technical College is committed to transparency and accountability in reporting student success outcomes. This information is provided in compliance with federal Student Right-to-Know regulations and Minnesota State reporting requirements.
Why it Matters: These measures help students, families, and the community understand how Northland supports educational goals and workforce readiness.
Student Right-to-Know: Graduation and Transfer-Out Rates
The Student Right-to-Know Act is a federal law that requires colleges and universities to share specific information with prospective and current students. This page provides required data on graduation and transfer-out rates for full-time, degree-seeking students at Northland Community & Technical College.
Federal guidelines establish how these rates are calculated. They are based on a cohort of Northland students who begin in the fall as full-time students pursuing a degree, diploma, or certificate.
- Graduation rate: The percentage of students who complete their program at Northland within three years.
- Transfer-out rate: The percentage of students who do not graduate from Northland but transfer to another college or university within three years.
These figures provide useful context but do not represent all Northland students or experiences.
- Not all students are included in these calculations.
- As an open-access institution, many students begin with developmental coursework to strengthen reading, writing, or math skills before progressing to college-level classes.
- Students who move from full-time to part-time enrollment or “stop out” for one or more terms may take longer than three years to graduate.
- Some students enter the workforce before completing their program.
- Others may pause or delay their education due to personal, family, or financial circumstances.
Graduation and Transfer Outcomes by Cohort
This section highlights graduation and transfer outcomes for recent student cohorts at Northland, along with key demographic and financial aid breakdowns.
Fall 2022 represents the most recent cohort with available graduation and transfer-out data.
- Cohort Size: 243
- Percent of Student Body: 9%
| Northland | Graduation RatE | Transfer-Out Rate | Combined Rate | MinnState College Combined Rate |
|---|---|---|---|---|
| Fall 2022 | 51% | 17% | 68% | 60% |
| Fall 2021 | 56% | 11% | 67% | 59% |
| Fall 2020 | N/A | N/A | 62% | 57% |
| Fall 2019 | N/A | N/A | 64% | 54% |
| Fall 2018 | 43% | 19% | 64% | 55% |
| Fall 2017 | 43% | 18% | 62% | 54% |
Reported Race & Ethnicity
Due to rounding, percentages may not always add up exactly.
| Race & Ethnicity | Graduation RatE | Transfer-Out Rate | Combined Rate |
|---|---|---|---|
| American Indian or Alaska Native | * | * | * |
| Asian | * | * | * |
| Black or African American | 28% | 32% | 60% |
| Hispanic of any race | * | * | * |
| Native Hawaiian or Other Pacific Islander | * | * | * |
| Two or more races | * | * | * |
| U.S. Nonresident | * | * | * |
| Unknown race and ethnicity | * | * | * |
| White | 56% | 14% | 71% |
* Suppressed to protect student privacy.
Reported Student Gender
| Student Gender | Graduation RatE | Transfer-Out Rate | Combined Rate |
|---|---|---|---|
| Female | 51% | 21% | 73% |
| Male | 50% | 13% | 63% |
Financial Aid Markers
| Markers | Graduation RatE | Transfer-Out Rate | Combined Rate |
|---|---|---|---|
| Pell Grant Recipient | 43% | 18% | 61% |
| Received neither Pell nor Subsidized Stafford Loans | 57% | 15% | 71% |
| Received Subsidized Stafford Loans, but no Pell | 50% | 23% | 73% |
Student Success Accountability Metrics
Understanding student achievement measures is crucial for assessing how effectively Northland supports academic progress and career readiness. These indicators—ranging from developmental education completion to graduation, licensure success, and employment outcomes—provide a clear picture of student persistence and long-term success. Reviewing these data helps identify strengths and opportunities to improve student support and outcomes.
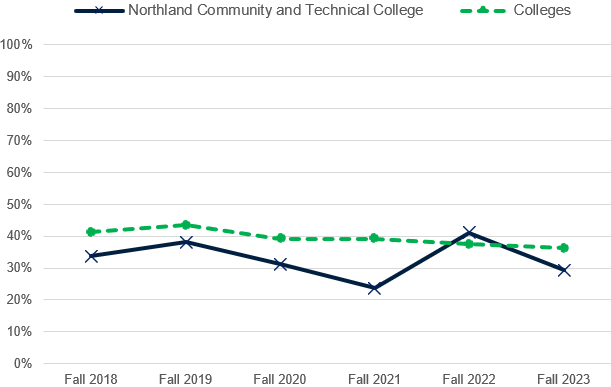
Developmental Education One-Year Completion Rate
Of students who took developmental reading, writing, or math within two years of the fall entering cohort term, those who completed all developmental coursework within one year.
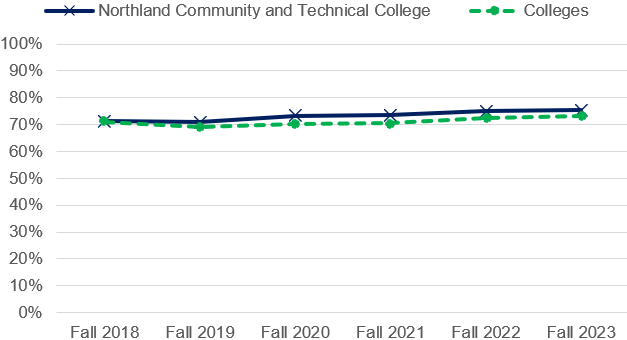
Second Fall Student Persistence and Completion Rate
Percent of a fall entering cohort of regular and transfer students who have been retained, graduated, or transferred by the second fall term following original fall enrollment.
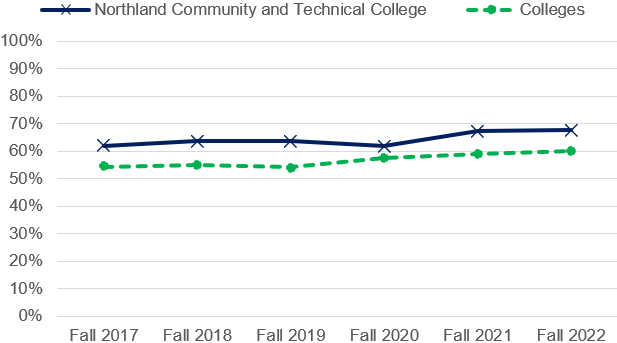
Completion Rate (Full-Time Students)
The percentage of an entering cohort of undergraduate regular and transfer students who have completed. Completion is measured as graduation or transfer by the end of the third spring after entry at the college.
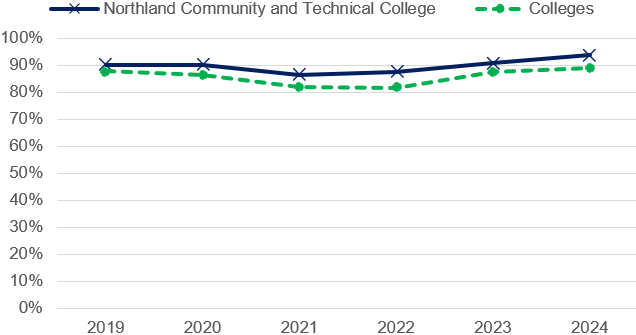
Related Employment Rate for Graduates (Full- and Part-Time)
The percentage of institution graduates who were available for related employment in the year after graduation, and who reported being employed during the year after graduation in a job related to their program or major.
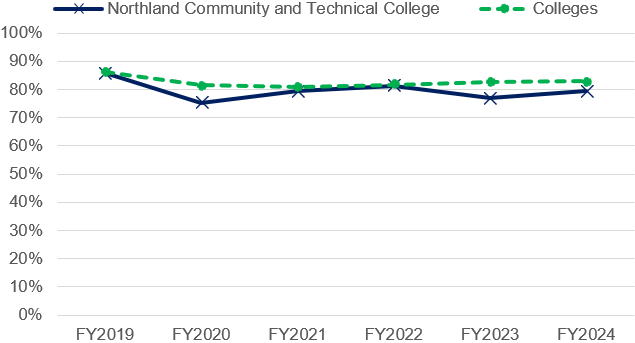
The standard 80-85% response rate for the graduate follow-up survey was met by Northland each year.
Licensure Exam Pass Rate
The percentage of students or graduates in a cohort who passed a state or national licensure examination. This measure is a weighted average pass rate and currently includes four licensing exams: nursing, teaching, peace officer, and radiography.
As of FY2024, licensure data for teaching is no longer available due to changes in Title II reporting requirements. The most recent data reflect individuals tested during the 2020–2021 academic year, which may affect overall trend comparisons for programs that included teacher licensure.
Data source: Minnesota State Student Success Accountability Metrics and IPEDS. Data are updated annually.
Last updated: June 2026.